JTL-BI developer diary: Exploit your potential with concentrated business intelligence
At the beginning of the digital age, it was always said that “data is the new currency”. However, retailers know best: without sound analyses and evaluations, this currency remains worthless. This is why we are working on our business intelligence solution JTL-BI. It can be used to draw valuable insights from the mountains of data generated in day-to-day business. In this developer diary, we provide an update on the progress made with JTL-BI and report on the experience we have already gained from working with pilot customers.
What exactly does JTL-BI do?
Collect, analyse, visualize – what JTL-BI does for you can be broken down into these three words. However, this does not make the task any less complex. Basically, business intelligence applications such as JTL-BI specialize in evaluating data from different sources so that you as a retailer can make better business decisions. Which products are slow sellers? How much staff do I need to plan for the peak season? With growing sales and an increasing number of sales channels (keyword Multichannel retail), it is becoming increasingly difficult to answer such questions ad hoc. JTL-BI is a tool with which you can find the answers you need based on sound data analyses. Interactive graphics and detailed filter options help you to draw conclusions and ultimately make decisions.
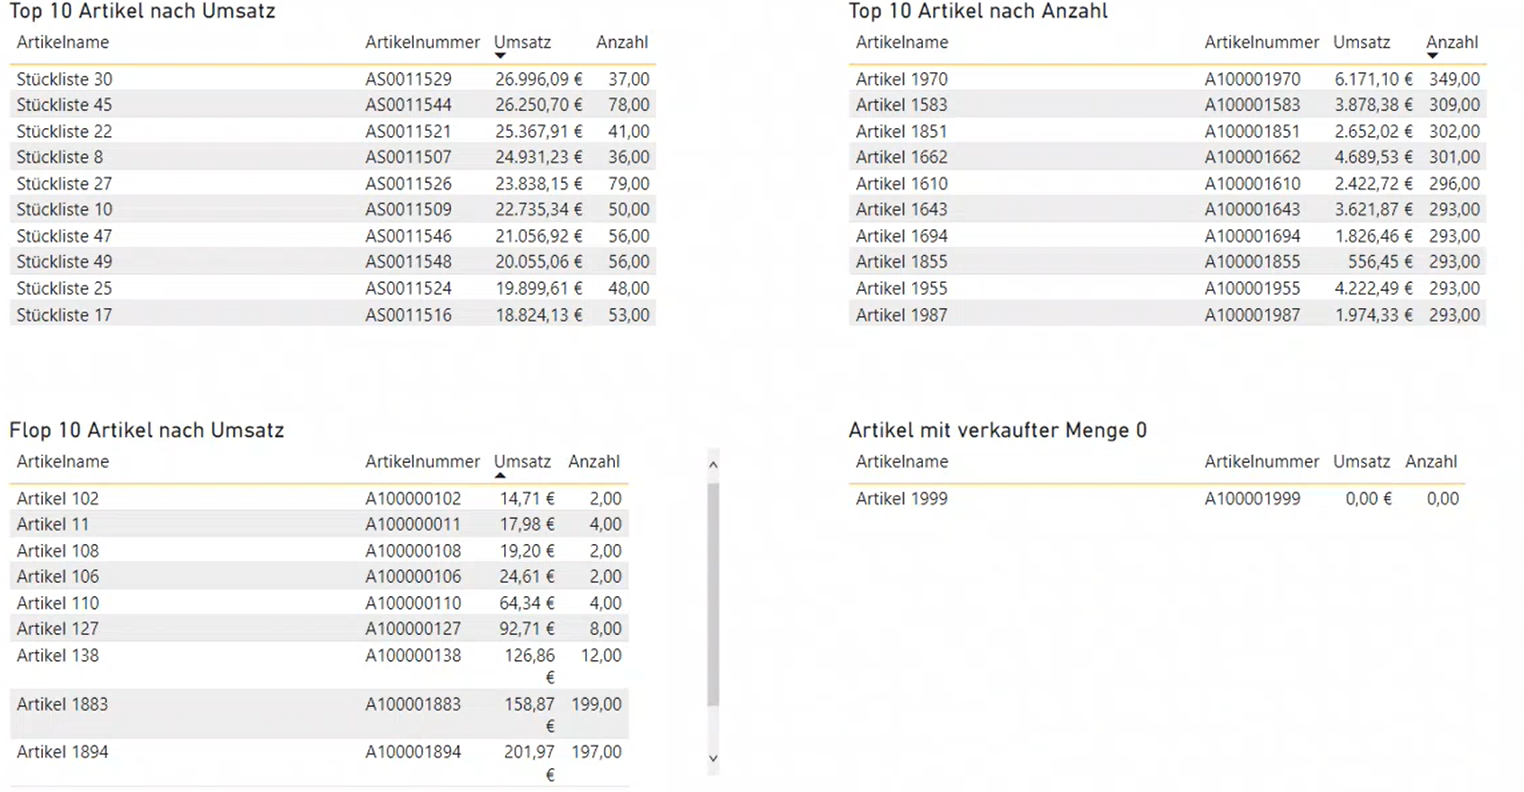
Overview of which items generate the most sales and which generate the least
JTL-BI can do more than the statistics functions in JTL-Wawi
Compared to the statistics functions in your ERP, our new solution is far more flexible and powerful. Although you can also view company KPIs in JTL-Wawi, you cannot provide the actual context in which key figures are set in relation to each other. Another difference: although the data that JTL-BI uses comes from your ERP, the data is stored in a database created specifically for this purpose.
You want to know more about the JTL-BI database? In this Developer diary we go into detail about its design and functionality.
Optimum system openness with Microsoft Power BI
A well-founded database is only half the battle for a business intelligence solution. A so-called BI suite is required to prepare the data in a user-friendly and clear way. This acts as the front end system for the connected database. Here we have opted for Microsoft Power BI (PBI). It is one of the most widely used business intelligence systems in the IT world and enables the use of number-based information from a wide variety of sources – in our case the SQL server with JTL-Wawi. However, you can also use data from an Excel or CSV file and link it directly to PBI.
Third-party systems such as Google Analytics can also be easily integrated into Power BI – a dream come true for controllers, logistics or product range managers who need to look beyond their “data horizon” in order to recognize correlations between search engine marketing and orders, for example. If you want to make strategic decisions, recognize trends or important developments, the solution is exactly the right tool for you. Power BI also offers benefits in terms of usability:
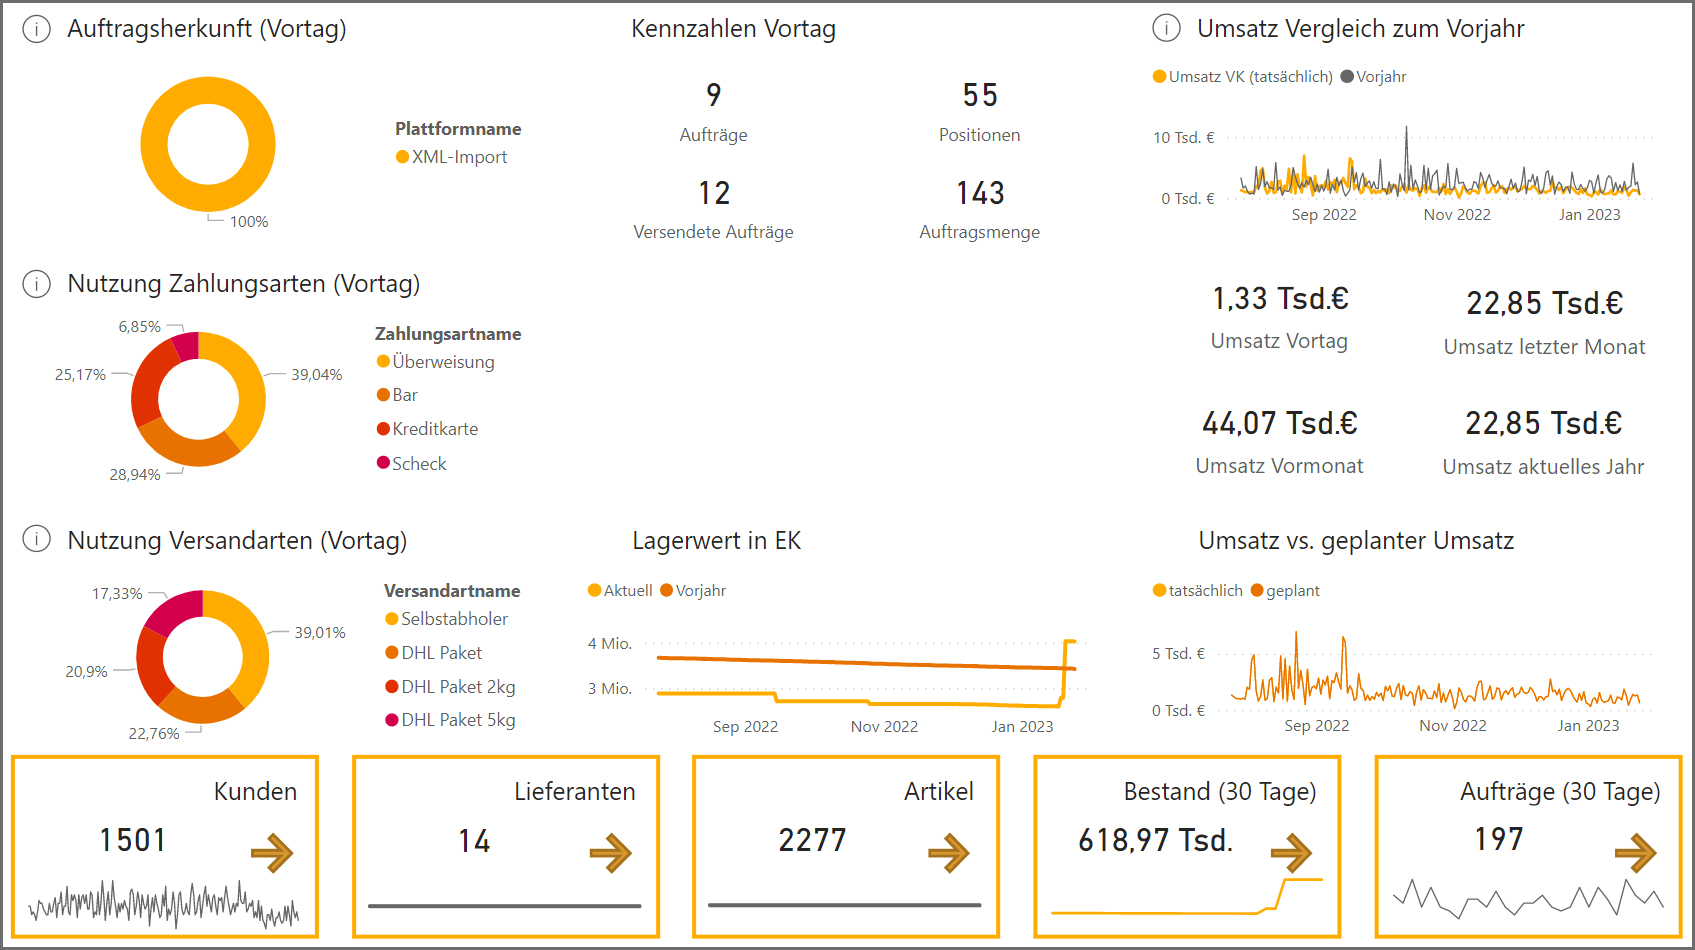
Customizability: Tables and charts can be customized as desired, from the choice of colors and chart type to the arrangement. We have already created the most common reports as templates, but you can also upload your own solutions if required.
Interactivity: The views change at the same time as the filter selection.
Automation capability: Power BI gives users access to the Microsoft Power Platform, which includes automation solutions such as Power Automate. This opens the door to unimagined efficiency – here is a use case: If a number of regular customers have not ordered anything for over 100 days, the respective customer numbers could be transferred to the customer relationship management system via Power Automate in order to send out automatic mailings with discount vouchers to encourage purchases.
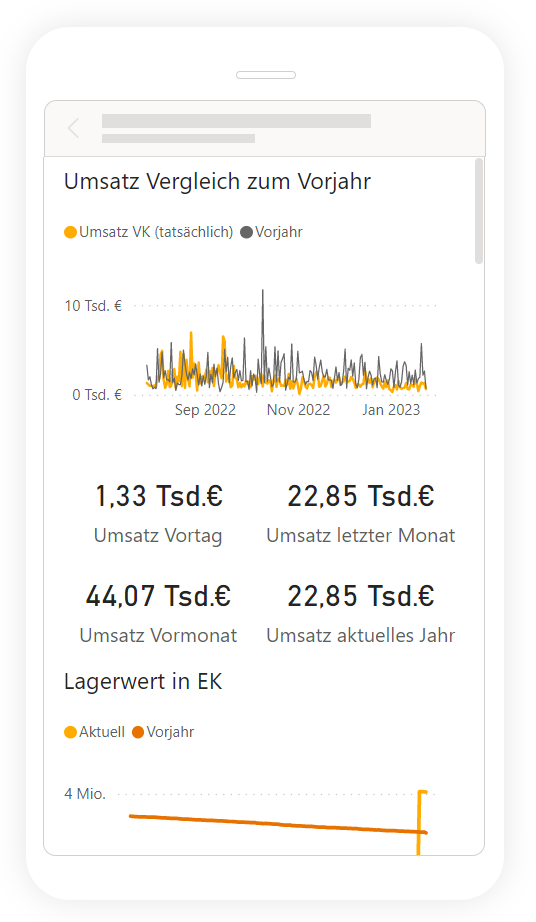
Free choice of operating mode: Power BI is available as a cloud, desktop and mobile Application. This means you also enjoy maximum flexibility and can decide for yourself where and on which device you want to use the business intelligence application.
Ease of use: Last but not least, PBI can also be used without in-depth IT knowledge. However, there is one highlight for developers: if required, they can implement special requirements with certain programming languages. For example, Power Query is used to load data, DAX to build custom fields – similar to Microsoft Excel – and Python for in-depth data analysis.
Pilot customer Lars Peczan, who runs Boddenangler GmbH, an online specialist retailer for fishing equipment, is already convinced: “JTL-BI is a first-class addition to JTL-Wawi. Thanks to the many filter and diagnostic options, we can react quickly to anomalies in our data. The intuitive user interface and comprehensive reporting features make it an ideal solution for companies that need a complete overview of their performance and decisions. All in all, JTL-BI is a very powerful tool that enables quick and complete analysis of company metrics.”
Integrate everything thanks to web portal solution
The development of well-founded business decisions and strategies depends on a holistic view of your own retail business. For example, what good is a detailed sales breakdown of the best-selling products if I don’t have an overview of running costs such as rent, electricity or staff? This is exactly why we are working on expanding JTL-BI with a web portal solution. Thanks to API technology, you will be able to connect any software to JTL-BI. From areas such as accounting to logistics, a wide variety of data can be compared and analyzed. As you can log in via your central JTL-Customer Centre account, you can get started immediately without additional registration. With a differentiated rights system, we ensure that you can determine exactly who has access to which data.
JTL-BI is already proving its worth
In line with our credo of community-driven development, we are already involving around 30 pilot customers in the early development phase in order to learn from their experiences. We attach particular importance to intensive and personal one-to-one support. We are currently planning to expand the user group in the next stage of the current pilot phase and then go into closed beta at the end of 2023. We are already looking forward to making JTL-BI available to a larger group of merchants. So stay tuned! Our biggest challenge will be to cover the needs of different industries within JTL-BI. For example, a fashion retailer has different requirements for a business intelligence solution than a manufacturing retailer for food supplements.
With JTL-BI, our business analysis is more comprehensive and, above all, less complicated. We can finally visualize all company data in one place and make decisions quickly.
Conclusion: Business intelligence solutions are useful for all retailers
As you can see, we have already taken a few steps with JTL-BI, but we are still a long way from reaching our goal. We are still working on implementing the feedback from the JTL-BI survey. Here we were able to determine that BI solutions are used across a wide range of industries and company sizes. Last but not least, we have recognized that many merchants already use smaller, self-developed business intelligence systems, but have to adapt them each time JTL-Wawi is updated. In order to save you this effort in the future, we are therefore relying on our own in-house business intelligence.
If you would like to participate in the development, you can log in to the JTL-Customer Centre for the pilot customer phase. We look forward to shaping JTL-BI together with you so that you can fully exploit your business potential in the future!