Welcome back! Last week, we introduced you to our new business intelligence solution JTL-BI in a blog post. It was initially about our database model and Microsoft Power BI as our front end design. This business analysis service offers you numerous advantages.
We would like to pick up on this point in part 2 of our developer diary. Today you can find out more about the interaction between JTL-BI and Microsoft Power BI and also which projects we will be tackling next. Finally, you will have the opportunity to actively influence the development of our Business Intelligence solution.
The advantages of Power BI at a glance
In addition to the advantages already mentioned, Power BI bidder us further advantages that made our decision to link JTL-BI to it easier:
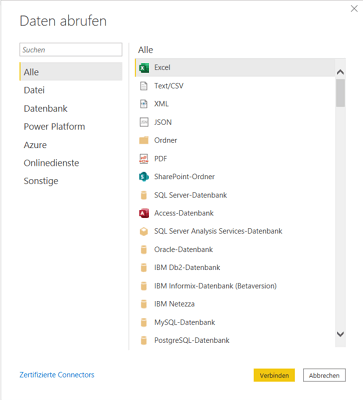
Numerous data sources can be linked
Several databases can be integrated into Power BI, giving you complete freedom when it comes to the sources for your evaluations. Possible data sources include various SQL servers (MSSQL, Oracle, MySQL), Excel sheets, CSV files, XML files or web interfaces.
Individual views
Power BI offers a wide range of customization options that you can use to adapt your overviews to your business. Power BI Desktop allows you to create your own visuals or tables and you can define the type of display (different chart types, colors, arrangement, etc.). The most common visuals are already created in Power BI, but it is also possible to upload your own coded solutions.
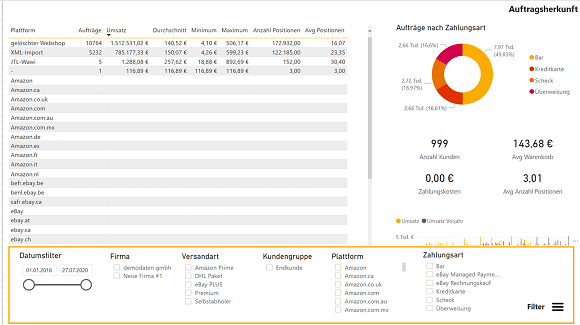
Interactivity
Power BI is particularly impressive with its active elements: depending on which filter you apply, the views change immediately. This interactivity is probably the biggest differentiating factor compared to the statistics in JTL-Wawi and therefore an important added value of JTL-BI.
Access to the Microsoft Power platform
Power BI opens the door to Microsoft’s Power platform: all the data you use there can be uploaded directly to Excel for further processing.
Drilldown and drillthrough
Drilldown is a Power BI feature that allows you to organize your data into hierarchies. Within a chart, you can use the drilldown function to view your turnover for the year, for example, and switch to the quarter or a single month with just one click. When using the data from JTL-Wawi, it would be, for example, the shipping methods with the carrier (DHL, DPD etc.) on the first level and the exact shipping method with the carrier on the second level.
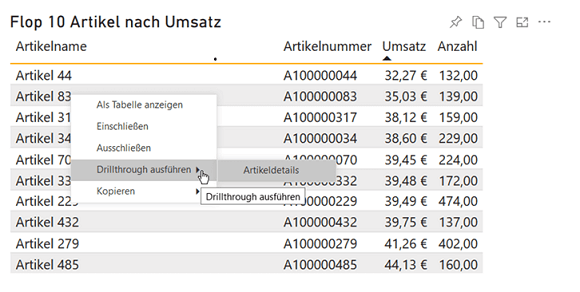
In addition to drilldown, Power BI also offers a drillthrough: Here you can jump from a data set, such as your top/flop items, directly to the detail page of one of these items.
Power BI as a cloud variant
Microsoft Power BI is not only available as a desktop version, but can also be used via the cloud. With the former variant, you do not have to upload any data to the cloud, but the functions are somewhat more limited. With Microsoft Power BI as a cloud variant, you have significantly more options and even work free of charge with the single-user license. You only incur costs if several people access the data. Whether desktop or cloud: We have coded the reports that we provide in JTL-BI so that they are fully usable for both variants.
Our next projects in development
Of course, our development activities in JTL-BI are far from over. The following to-dos are on our agenda for the near future:
Integration of JTL-Shop and other evaluations
The possibility of integrating JTL-internal evaluations is our first priority. We are currently working on the warehouse evaluations (stock turnover rate, out-of-stock analyses, etc.). To this end, we are reviewing the data model, as very large volumes of data are generated very quickly in this area in particular. This is because a separate data record is required for each day, item and storage bin.
In the long term, we also plan to integrate data from other JTL products for you. JTL-Shop would be the first choice here to increase the overview of your sales. In the near future, we will have to explore which information we can get from JTL-Shop and which we can make usable for JTL-BI. But topics such as optimizing procurement or determining a reorder point are also on our agenda.
Own visuals
As we have already written, Power BI already has numerous integrated visuals. In a further development phase, however, we would also like to integrate our own visuals and are open to your suggestions. As with many other JTL products, we are again pursuing the “community-driven development” approach and will – probably during the open beta – ask for your requirements and wishes for the visuals.
Survey on JTL-BI
But we also need your feedback on the current state of development: we have launched a survey to incorporate your ideas into our further work on JTL-BI.
We are also currently preparing to integrate the first pilot customers into the JTL-BI system: Server configuration, deploy process and much more is currently on our agenda.
Become a pilot customer for JTL-BI!
Would you like to become a pilot customer for JTL-BI? Great! The test phase will probably start shortly before the release of JTL-Wawi 1.6, as the comparison with JTL-BI only works with this version of our ERP. It is therefore necessary that you upgrade to JTL-Wawi 1.6.
If you are interested in actively influencing our development and being one of the first to test both JTL-Wawi 1.6 and JTL-BI, please contact our sales department. We will then clarify the details: