“Know your figures” is typical advice for entrepreneurs. Because only those who keep an eye on their own company figures can recognize developments and derive strategic decisions from them – this is essential for sustainable success.
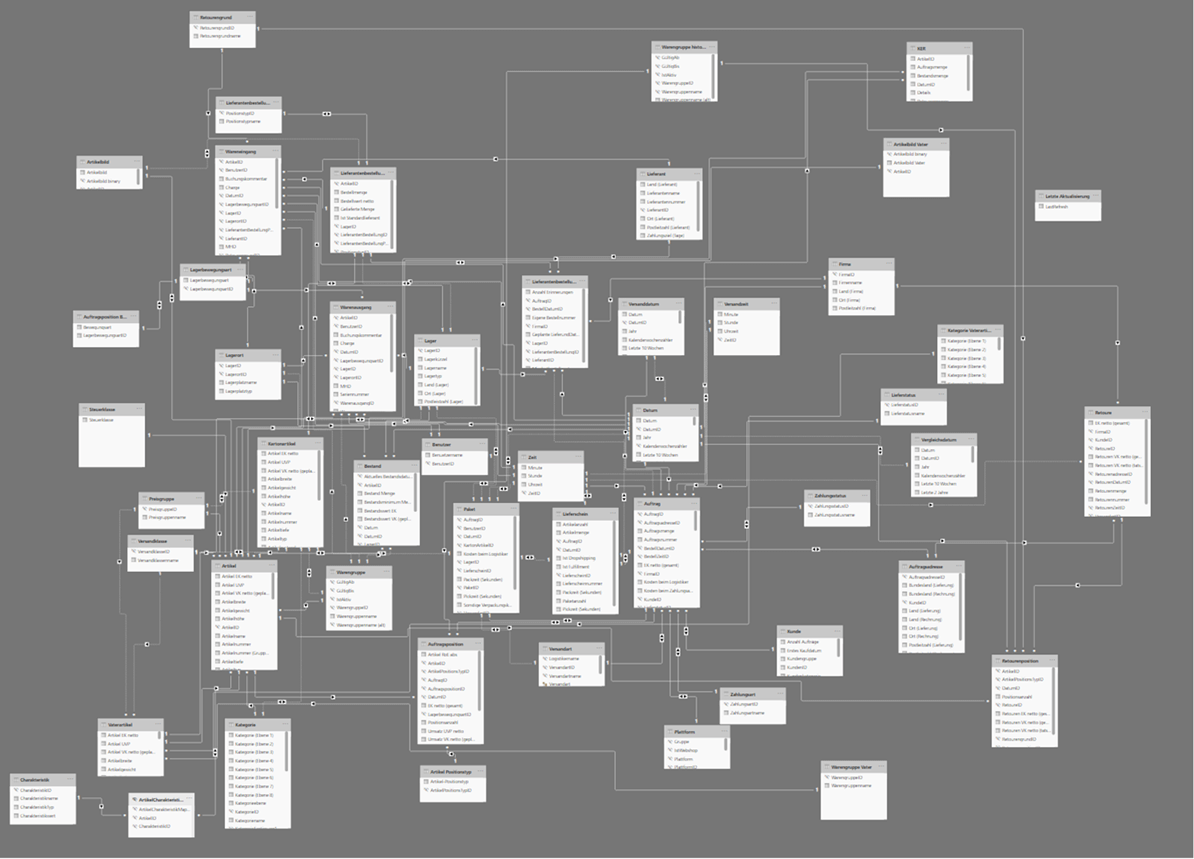
Our new product JTL-BI should make all this possible for you in the future. As the possible applications are so extensive, we have divided our developer diary into two parts: This week, we will first give you an insight into our work to date and present our database model.
Next week it will be about the connection to Microsoft Power BI and you will have the opportunity to actively participate in the development.
But let’s start from the beginning:
What is JTL-BI?
JTL-BI is our business intelligence solution designed to help you systematically collect, analyze and present the data in your company. All with the aim of making number-based and therefore more informed decisions that will drive your company’s success. Examples of this are cost reductions, risk reduction or value creation.
In short: JTL-BI gives you a comprehensive overview of your company and thus more control.
How does JTL-BI differ from the statistics in JTL-Wawi?
We have already introduced you to the idea of JTL-BI in a previous post. Since then, we have been asked again and again how our project differs from the statistics in JTL-Wawi. After all, you can also view company key figures here.
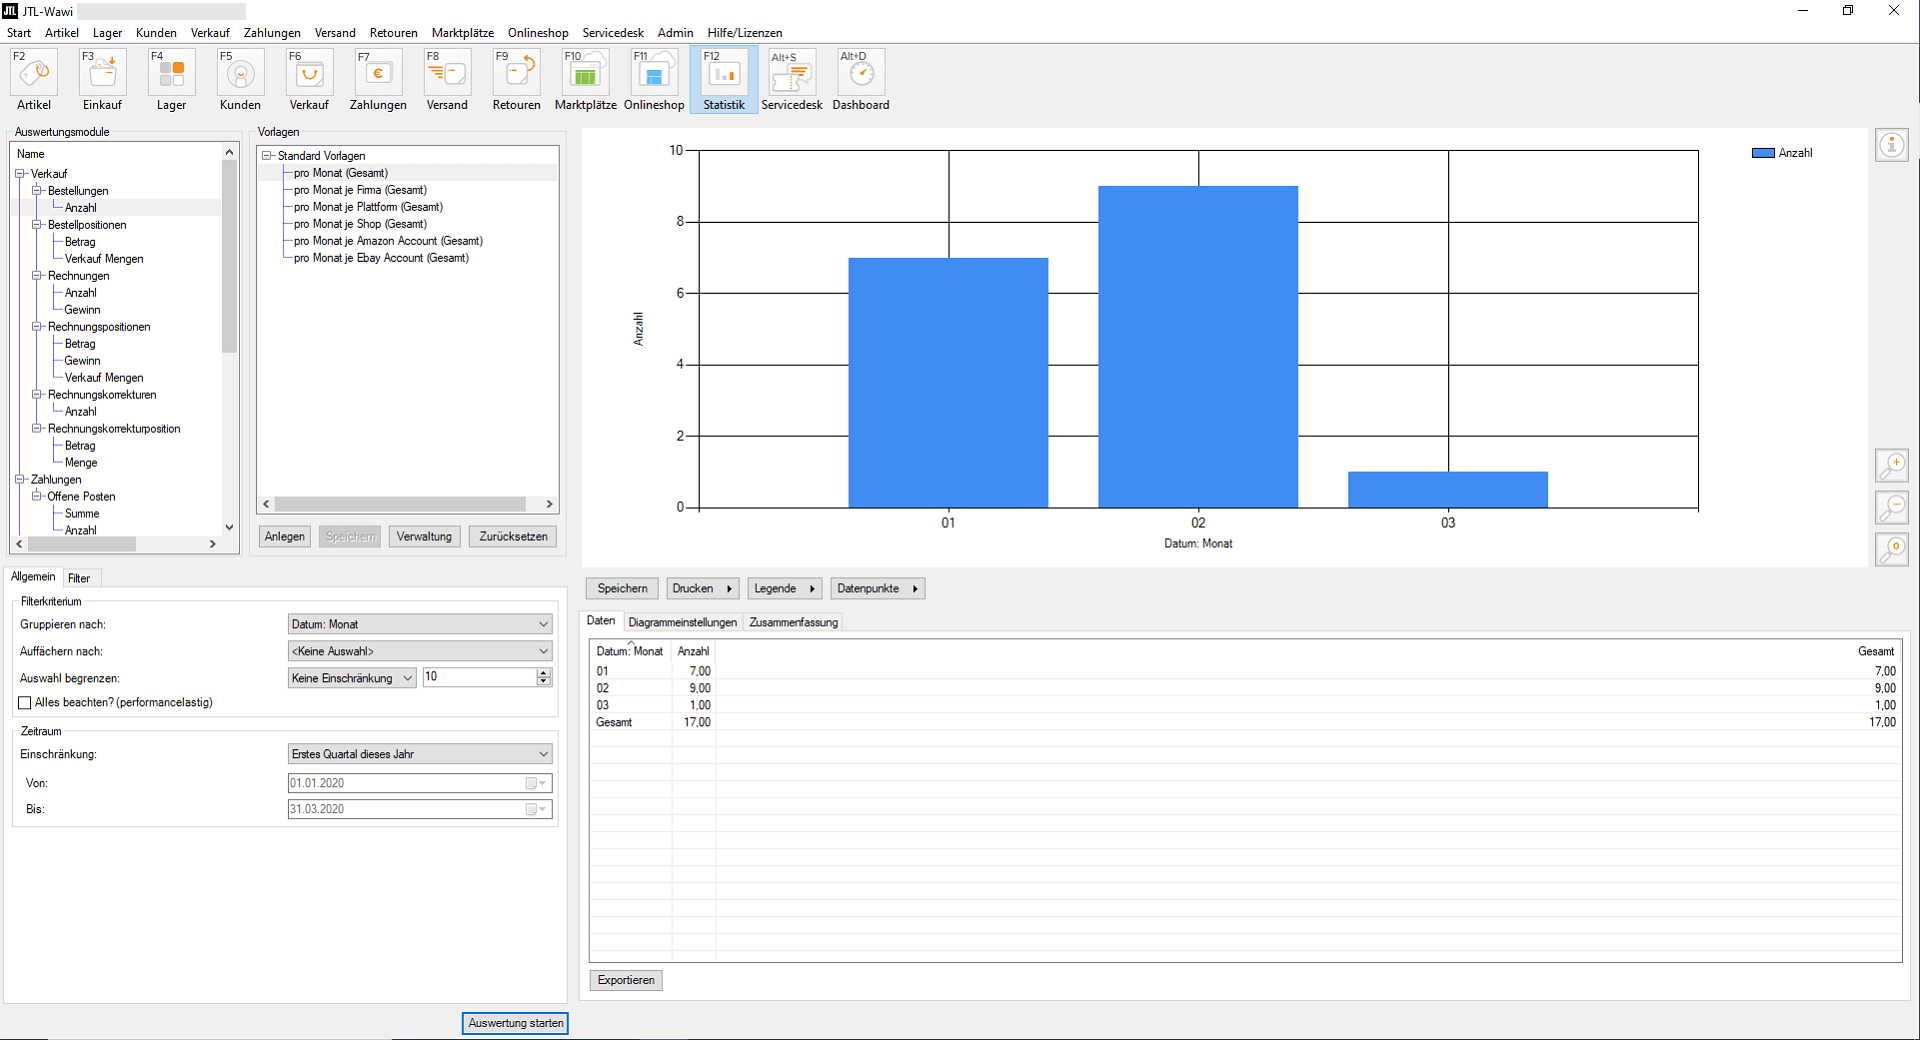
However, there is one crucial difference: the statistics in JTL-Wawi show individual key figures, such as outstanding payments or the number of returns and orders. However, JTL-Wawi does not place these in a systematic analysis context, which an online retailer, logistics manager or product range manager needs in the long term for their strategic decisions.
JTL-BI, on the other hand, compiles information in such a way that you can recognize trend developments and, as Managing Director, derive a need for action from them.
The data that JTL-BI makes visible to you comes from JTL-Wawi. However, the data storage of our business intelligence solution runs on an autonomous database, for which we first had to create our own structure.
Own database structure for JTL-BI
A high-performance BI solution cannot work on the database of an ERP system. On the one hand, because different rules for data storage apply here. On the other hand, because the attached database of JTL-BI would have a negative impact on the performance of JTL-Wawi – especially for larger companies with extensive data sets. We therefore had to create our own database (structure).
This has a decisive advantage: by developing your own database, you will also be able to integrate third-party systems – such as Unicorn or Facebook Analytics – to integrate these data sets in the future.
How the JTL-BI database works
The database design of JTL-Wawi and that of a data warehouse such as JTL-BI is fundamentally different: JTL-Wawi runs on a normalized database in which the attributes are divided into several relations in such a way that no redundancies arise. The aim of such redundancy-free data storage is to be able to remove data without any loss of information. A normalized database such as the one used by JTL-Wawi is designed to write data quickly and only read data in small quantities.
JTL-BI is completely different: we have developed the database of our Business Intelligence solution according to a star schema, as is usual for a data warehouse. We have even created snowflakes and galaxies that are particularly suitable for large amounts of data with almost exclusively read access and only infrequent write access. We also stored the data in the database multiple times to guarantee maximum evaluation speed.
We use this database to carry out the standard evaluations, which we then display in a separate user interface using browser-enabled navigation. But more on this later.
The comparison between JTL-BI and JTL-Wawi
As already mentioned, JTL-BI uses some of the data from JTL-Wawi. This makes regular synchronization necessary, as is the case with JTL-Shop, for example. Unlike store synchronization, however, the data is only transferred to JTL-BI once a day – and only data that has changed since the last synchronization. And this is exactly how it works:
We have now developed this comparison to the point where we can test it with our first pilot customers. You can find out more about this in part 2 of our developer diary next week.
JTL-BI and Microsoft Power BI
You may have already come across the term “Microsoft Power BI” while reading this and are now wondering what this external business analysis service has to do with our Business Intelligence solution:
Microsoft Power BI is one of the most popular solutions in the field of business intelligence and we use this system as the front end for JTL-BI. We already rely on Microsoft with our SQL server, so it made sense to link JTL-BI directly to it.
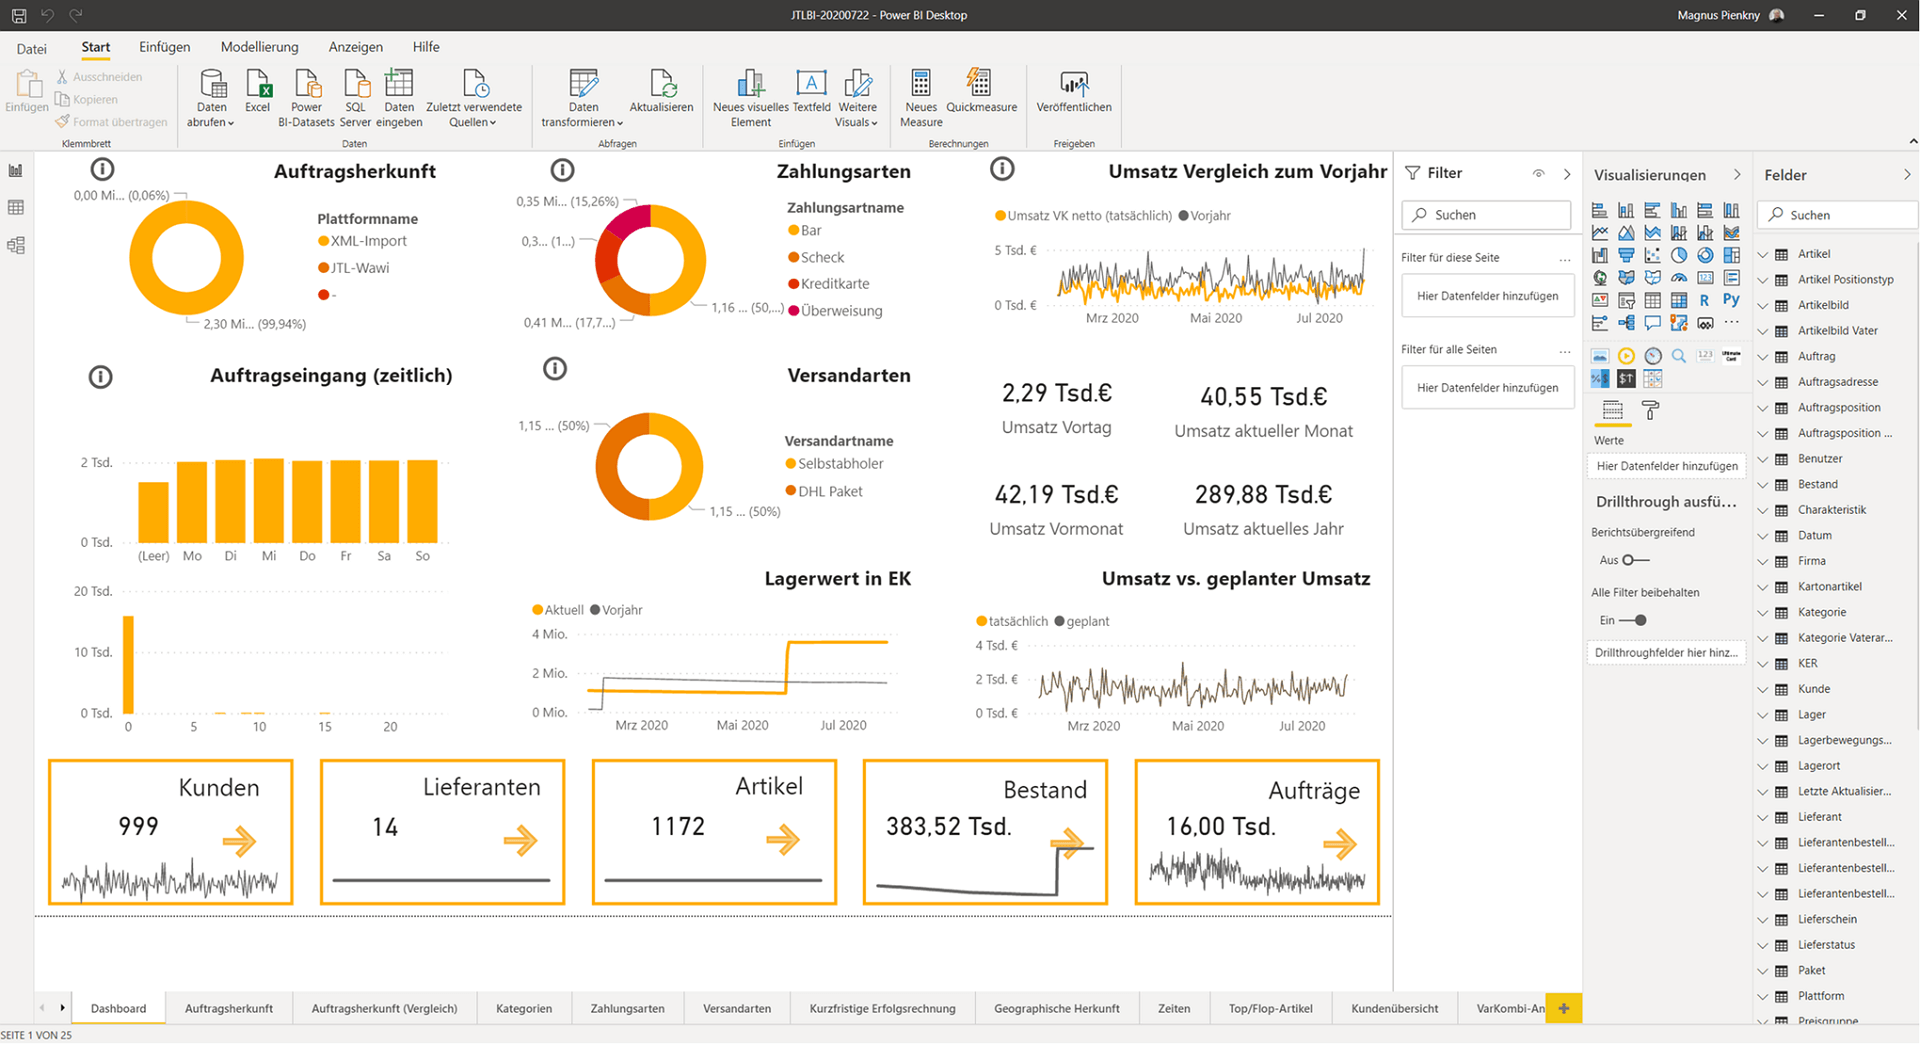
Microsoft provides connectors for our SQL Server in Power BI. When developing our data warehouse, we took care to provide the data in such a way that we can use it directly in Power BI. This minimizes the need for you to rework or readjust the program. For example, we have translated technical terms at SQL level and named the columns in such a way that they can be understood directly.
A little treat for the developers among you: Programming languages such as Python or R can also be integrated into Power BI for statistical evaluations. Or you can react to data via Microsoft Power Automate – similar to the workflows in JTL-Workflows.
The use of Microsoft Power BI actually offers a whole host of advantages for the further development of JTL-BI. One of these is certainly that you can use the service not only as a cloud version, but also as a pure desktop version. But you can find out more about this in part 2 of our developer diary. In it, we will also explain what plans we have for the integration of JTL-Shop and other systems for analysis. Stay tuned!